Coastguard : Passage Plan : Visualisation
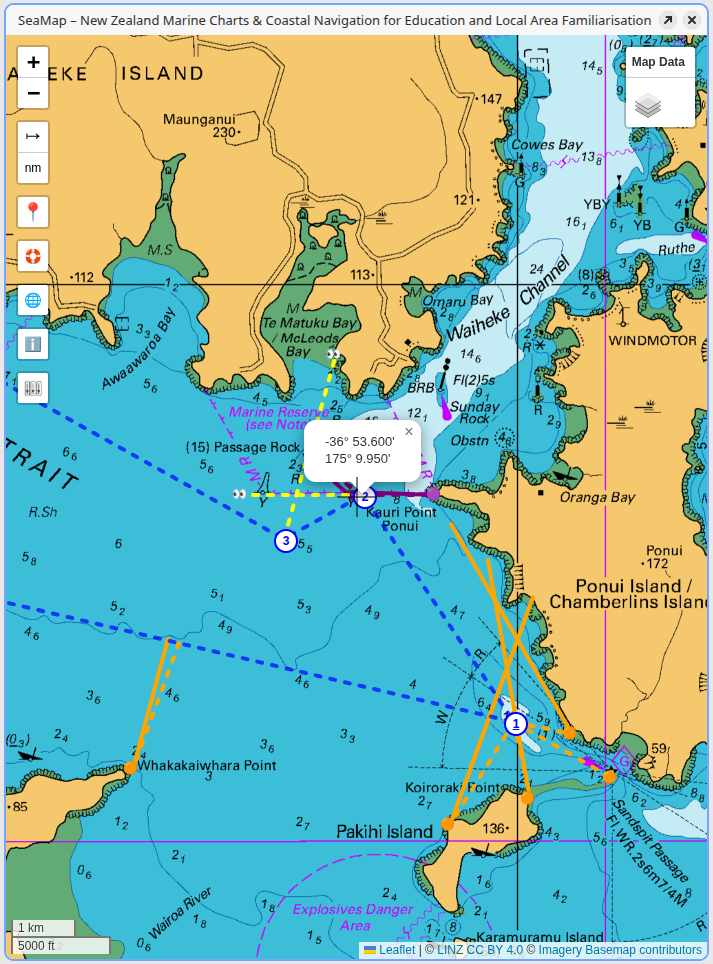
As details are entered for each activity, the map page is updated to show details of the activity.
Most of the nodes for these activities can be dragged to new positions with the form being updated accordingly.
Flicking between different background maps can be used to help the student understand how well the activity will work in reality.
Expected values are shown as dotted lines, and if actual values are provided they are shown as solid lines.
See the image below where actual values have been entered to demonstrate a 'cocked hat' at Green Bay.
Eventually the passage plan needs to be re-drawn on a paper chart ready for the practical examination.